test 4
R Markdown
This is an R Markdown document. Markdown is a simple formatting syntax for authoring HTML, PDF, and MS Word documents. For more details on using R Markdown see http://rmarkdown.rstudio.com.
When you click the Knit button a document will be generated that includes both content as well as the output of any embedded R code chunks within the document. You can embed an R code chunk like this:
summary(cars)
     speed           dist
 Min.   : 4.0   Min.   :  2.00
 1st Qu.:12.0   1st Qu.: 26.00
 Median :15.0   Median : 36.00
 Mean   :15.4   Mean   : 42.98
 3rd Qu.:19.0   3rd Qu.: 56.00
 Max.   :25.0   Max.   :120.00
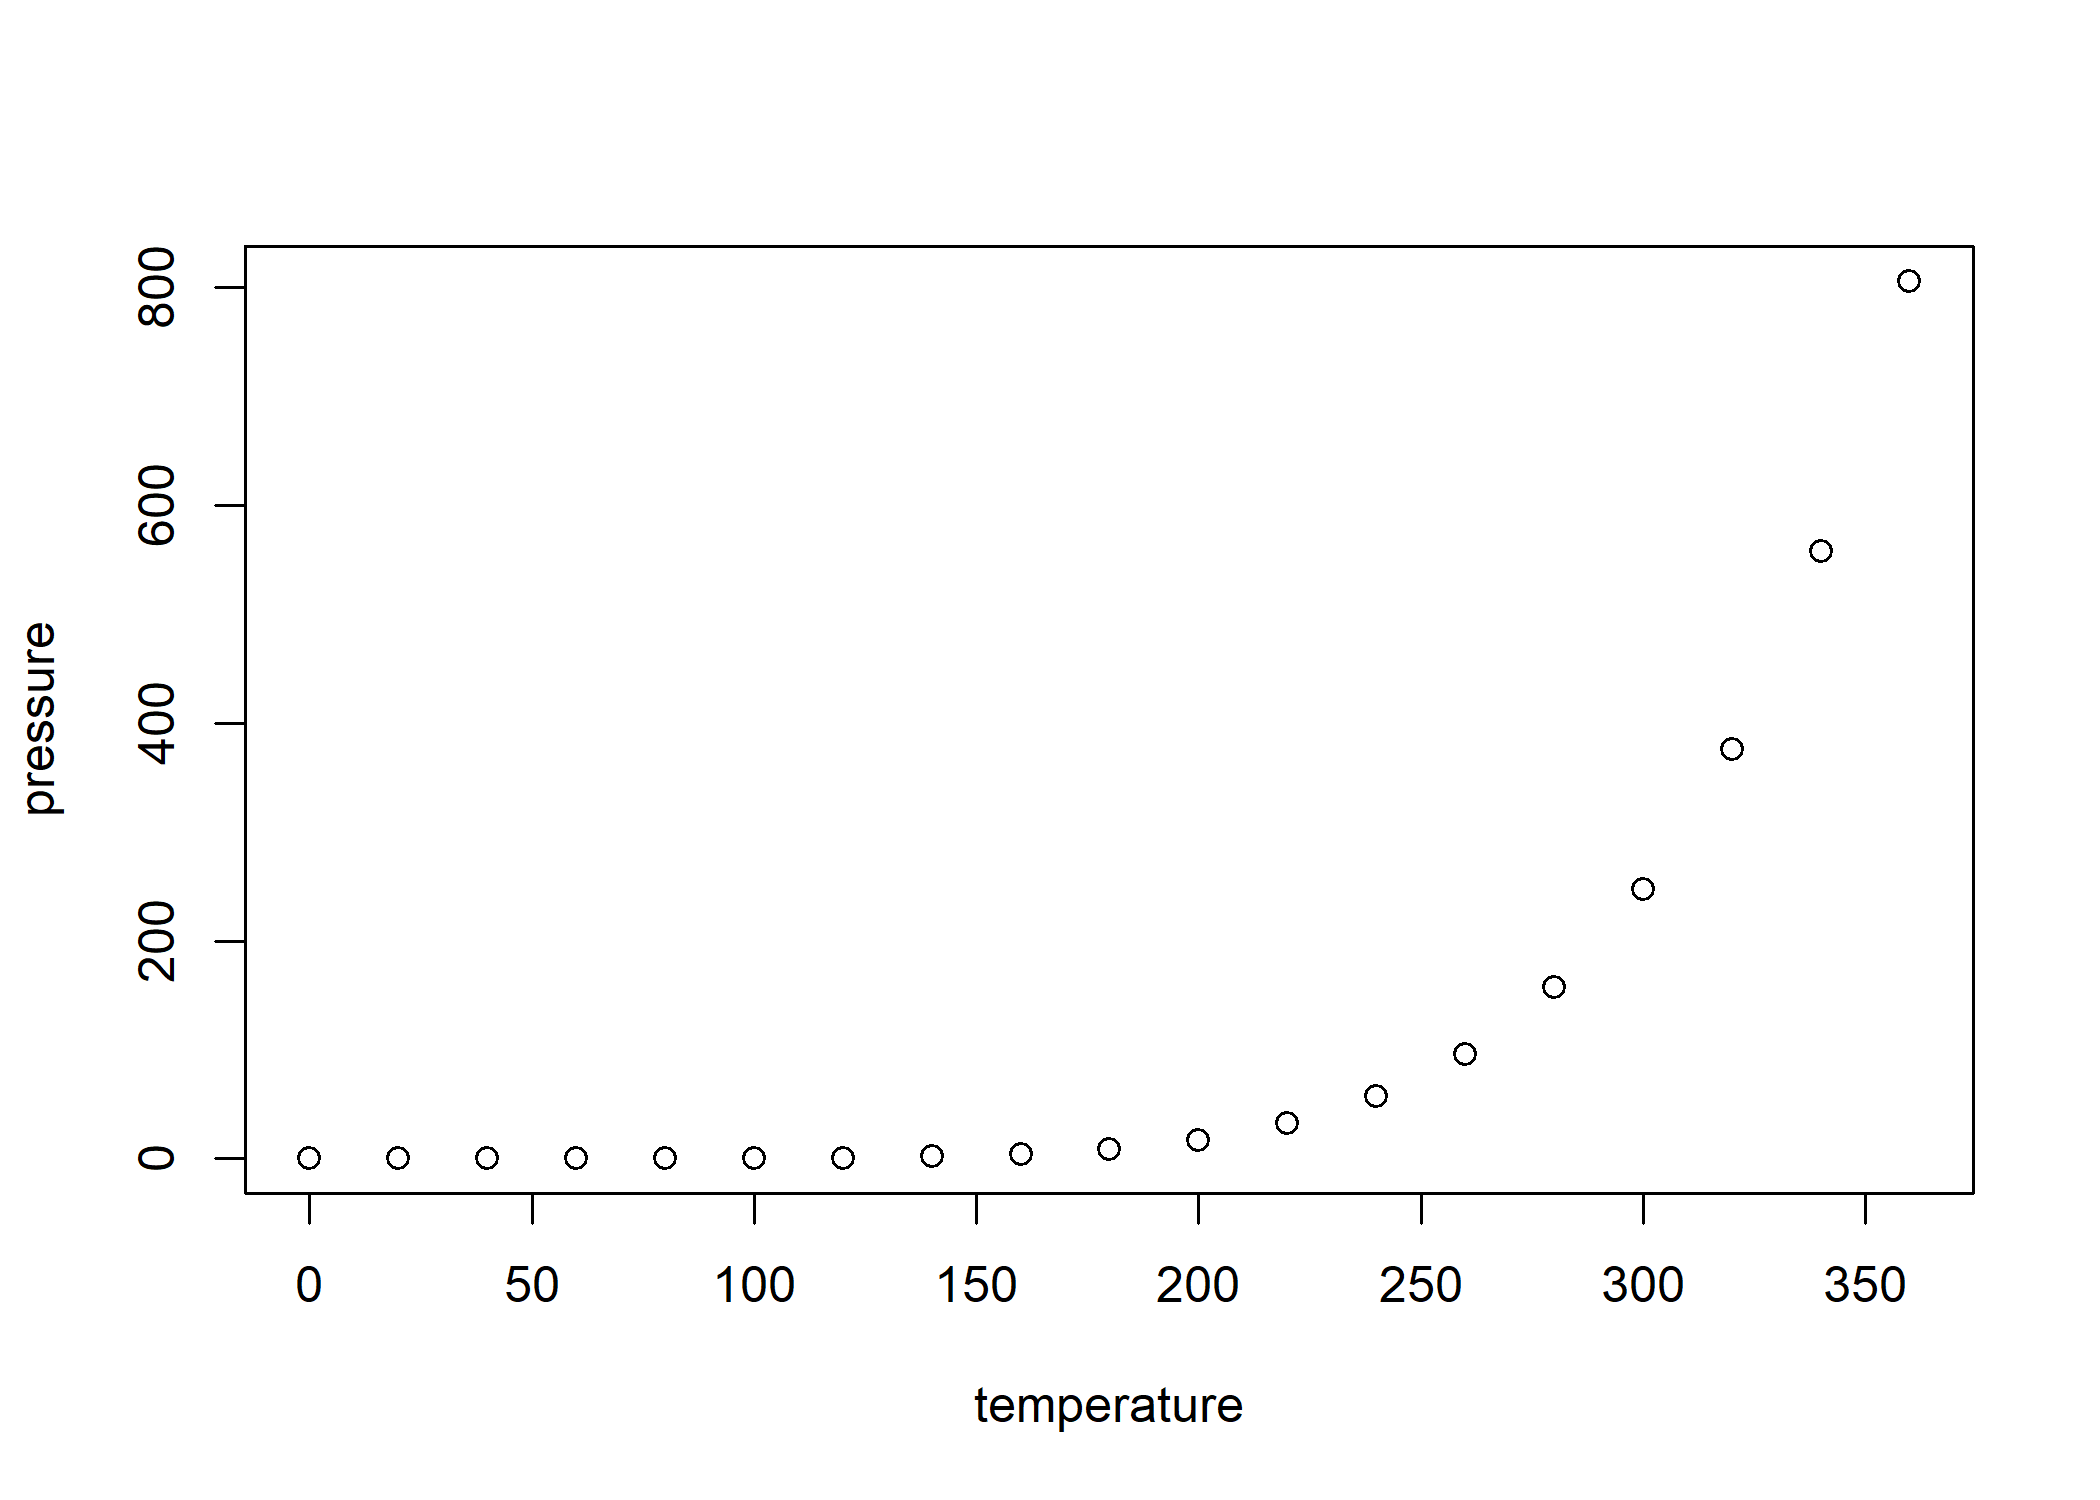
Including Plots
You can also embed plots, for example:
Note that the echo = FALSE parameter was added to the code chunk to prevent printing of the R code that generated the plot.
library(plotly)
library(htmlwidgets)
library(metricsgraphics)
#x <- c(1:100)
#random_y <- rnorm(100, mean = 0)
#data <- data.frame(x, random_y)
#
##py = plotly("RgraphingAPI", "ektgzomjbx")
##py$ggploty(plot1, session="knitr")
#plot1 = plot_ly(data, x = ~x, y = ~random_y, type = 'scatter', mode = 'lines')
#
#plot1
plots <- lapply(1:4, function(x) {
  mjs_plot(rbeta(1000, x, x), width = 300, height = 300, linked = TRUE) %>%
    mjs_histogram(bar_margin = 2) %>%
    mjs_labs(x_label = sprintf("Plot %d", x))
})

mjs_grid(plots)